A real government report. A memo a real AI wrote. Nobody tells you how many mistakes it has, and there isn't time to read and check everything.
About 15 minutes
No sign-up
Thursday, 2:30 PM
You've been at Northline Research for two months. Businesses and schools pay Northline to answer questions like the one below. Maya, your boss, now gives you real client work.
Bridgeway Career School hired us, and its owner, Dana, needs an answer on a 3:15 call. Bridgeway is a small trade school in Lima, Ohio. It has the money to open one new training program next fall, and Dana has to tell the school's board, the people who approve big decisions, at 4:00 which one.
The three choices are solar installer, physical therapist assistant and data analytics.
Your coworker Jordan had the AI write a memo last night and then left on vacation. It's on your desk, next to the new jobs report from the Bureau of Labor Statistics, the government office that tracks jobs. BLS for short.
Please check the memo and get it to me by 3:00.
Jordan's memo
Source: BLS 2024-34 projections and May 2024 pay, quoted from memory and rounded; a newer 2025-35 set may be out, so check bls.gov/ooh before you sign anything.
Solar installer: jobs projected to grow about 42% from 2024 to 2034, among the fastest of any occupation.
Solar installer: roughly 12,000 new jobs nationally, on a small base of about 30,000 jobs.
Solar installer: median pay is about $52,000 a year.
Solar installer: training is a high school diploma plus a few weeks to a few months of certificate training.
Solar installer: BLS made its forecast before the federal residential solar tax credit ended after 2025, so growth may come in lower.
Physical therapist assistant: jobs projected to grow about 20% from 2024 to 2034.
Physical therapist assistant: roughly 20,000 new jobs nationally.
Physical therapist assistant: median pay is about $64,000 a year.
Physical therapist assistant: training is a two-year associate degree from a CAPTE-accredited program, which a new school cannot get in time for fall 2027.
Data analytics: the closest BLS category is data scientists, projected to grow about 34% from 2024 to 2034.
Data analytics: about 82,000 new jobs nationally, the most of the three.
Data analytics: BLS median pay for data scientists is about $112,000, but certificate graduates usually start in lower-paid analyst roles.
Data analytics: BLS data scientist jobs usually require a bachelor's degree, while certificate programs run 6 to 12 months.
Data analytics: entry-level analyst hiring is crowded, so build employer partnerships before you enroll students.
Recommendation: Open data analytics as a 6-to-9-month certificate, because it adds the most jobs, pays the most, and avoids both the PTA accreditation delay and the solar policy risk.
If you had the AI write a new memo with the report attached
All figures are U.S. national projections for 2025 to 2035, not Ohio-specific.
Solar photovoltaic installers: projected job growth of 36.5 percent, the fastest of the three.
Solar photovoltaic installers: about 11,300 new jobs nationally.
Solar photovoltaic installers: pay and training length are not in this BLS release.
Physical therapist assistants: projected job growth of 23.0 percent.
Physical therapist assistants: about 26,200 new jobs nationally, more than double solar.
Physical therapist assistants: pay and training length are not in this BLS release.
Data analytics: this release covers data scientists, not data analysts, so its figures are only a proxy.
Data scientists: projected job growth of 34.6 percent.
Data scientists: about 95,400 new jobs nationally, the most of the three.
Data analytics: pay and training length are not in this BLS release.
Solar installers and wind turbine technicians combined add fewer than 15,000 jobs by 2035.
Total U.S. employment is projected to grow 3.5 percent, or 5.9 million jobs, from 2025 to 2035.
The BLS Occupational Outlook Handbook (bls.gov/ooh) profiles include wages and training requirements.
State-level projections, including Ohio, are at projectionscentral.org.
Recommendation: Open data analytics training, since its closest proxy leads on growth and new jobs, but confirm pay and training length first.
The report
BLS-Projections-2025-35.pdf13 pages
NEWS RELEASE
BUREAU OF LABOR STATISTICS
U.S. DEPARTMENT OF LABOR
For release 10:00 a.m. (ET) Thursday, August 27, 2026USDL-26-1422
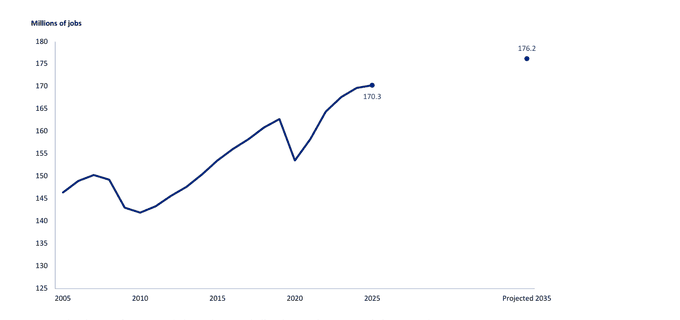
The U.S. economy is projected to add 5.9 million jobs from 2025 to 2035, the U.S. Bureau of Labor Statistics reported today.Total employment is projected to increase from 170.3 million to 176.2 million and grow 3.5 percent, which is slower than the 10.9 percent growth recorded over the 2015-25 decade. (See chart 1.)
Chart 1. Total employment, 2005-2025 and projected 2035
Note: Total employment refers to wage and salary employment and self-employment. The U.S. Bureau of Labor Statistics does not project interim years 2026-2034.
New Artificial Intelligence Exposure Categories
Alongside the 2025-35 projections, BLS is introducing a new data product that provides information about how occupations compare to one another based on their theoretical and observed exposure to artificial intelligence (AI).More information about the AI exposure categories can be found on release day at www.bls.gov/emp/publications/ai-exposure-categories.htm.
Chart 2. Employment change by major industry sector, projected 2025-2035
Employment change, percent, 2025-35
Employment change, numeric, 2025-35 (in thousands)
Utilities
9.8%
58.8
Healthcare and social assistance; private
9.5%
2,204.8
Professional, scientific, and technical services
8.6%
926.7
Arts, entertainment, and recreation
5.7%
153.1
Information
5.3%
151.0
Construction
5.0%
410.7
Accommodation and food services
4.3%
607.4
Management of companies and enterprises
4.1%
106.7
Other services (except public administration)
3.8%
246.8
Real estate and rental and leasing
3.4%
83.0
Transportation and warehousing
3.1%
207.3
Educational services; private
2.5%
102.1
Finance and insurance
2.3%
154.3
Wholesale trade
2.1%
125.2
Agriculture, forestry, fishing, and hunting
1.5%
21.6
Administrative services¹
0.9%
80.4
State and local government
0.9%
175.8
Mining, quarrying, and oil and gas extraction
0.7%
3.8
Manufacturing
0.6%
72.1
Retail trade
-0.2%
-27.5
Federal government
-3.4%
-98.5
¹Administrative services includes administrative and support and waste management and remediation services. Note: Major industry sector employment refers to wage and salary employment. Total employment refers to wage and salary employment and self-employment. Total employment = 3.5%.
Major Industry Sector Employment
Utilities is projected to have the fastest job growth (+9.8 percent) of all major industry sectors over the 2025-35 decade.However, this fast growth is projected to account for an increase of only 58,800 new jobs because of the sector's relatively small employment size. (See chart 2.)Nearly all the job growth is expected from electric power generation, transmission, and distribution due to increasing demand for electricity, including artificial intelligence (AI) power demands.
The private healthcare and social assistance (+9.5 percent) major industry sector is projected to add the most jobs of any sector, over 2.2 million over the projections period, and is projected to be the second fastest growing major industry sector.This strong growth is expected to account for about 37.0 percent of all new jobs projected to be added through 2035.Strong employment growth is expected to stem from both the aging population and the increasing prevalence of chronic health conditions, such as heart disease, cancer, and diabetes.
Demand for AI-based systems, research and development, and associated consulting services is expected to drive the need for workers in professional, scientific, and technical services.This major industry sector is projected to be the third fastest growing sector (+8.6 percent) over the projections period.This fast growth is projected to result in 926,700 new jobs, the second largest job growth of any sector.
-2-
Chart 3. Ten fastest growing industries, projected 2025-2035
Employment change, percent, 2025-35
Employment change, numeric, 2025-35 (in thousands)
Solar electric power generation
152.9%
26.2
Wind electric power generation
62.1%
8.3
Geothermal electric power generation
31.9%
0.3
Offices of mental health practitioners (except physicians)
27.6%
79.4
Other electrical equipment and component manufacturing
25.9%
45.5
Offices of physical, occupational and speech therapists, and audiologists
25.4%
130.6
Computing infrastructure providers, data processing, web hosting, and related services
25.1%
120.4
Services for the elderly and persons with disabilities
22.3%
625.4
Outpatient mental health and substance abuse centers
21.2%
70.0
Other electric power generation
20.1%
1.0
Note: Industry employment refers to wage and salary employment.
Employment in federal government (-3.4 percent) and retail trade (-0.2 percent) is projected to decline from 2025 to 2035.Retail trade is projected to lose about 27,500 jobs over the projections period, as e-commerce is expected to continue limiting employment in retail outlets.However, the growing volume of online purchases and therefore increasing volume of shipments and deliveries are expected to support employment growth in transportation and warehousing (+3.1 percent).
Fastest Growing Employment in Detailed Industries
The overall demand for electricity is expected to increase over the projections period due in large part to AI adoption and demand for related infrastructure, such as data centers.Consequently, projected employment growth in 4 out of the 10 fastest growing industries is expected to be driven, in large part, by demand for electricity.The solar, wind, and geothermal electric power generation industries are projected to be the fastest growing detailed industries. (See chart 3.)However, because of their relatively small employment size, these industries, when combined with the other electric power generation industry, are projected to add only about 35,800 jobs over the projections period.
Accelerated AI adoption is also expected to support employment growth in the computing infrastructure providers, data processing, web hosting, and related services industry.As a result, this industry is projected to grow 25.1 percent and add 120,400 new jobs over the projections period.
-3-
Chart 4. Percent change in total employment, by occupational group, projected 2025-2035
Healthcare support
13.3%
Healthcare practitioners and technical
8.0%
Life, physical, and social science
7.5%
Community and social service
7.4%
Computer and mathematical
7.3%
Architecture and engineering
6.8%
Management
6.2%
Business and financial operations
5.5%
Installation, maintenance, and repair
5.4%
Construction and extraction
5.1%
Personal care and service
4.4%
Food preparation and serving related
4.4%
Transportation and material moving
4.3%
Legal
2.9%
Building and grounds cleaning and maintenance
2.6%
Arts, design, entertainment, sports, and media
1.5%
Educational instruction and library
1.4%
Protective service
1.1%
Production
-0.4%
Sales and related
-1.4%
Farming, fishing, and forestry
-1.5%
Office and administrative support
-4.0%
Note: Total employment refers to wage and salary employment and self-employment. Total employment = 3.5%.
Other electrical equipment and component manufacturing, which includes production of batteries used for energy storage and in electric vehicles, is projected to grow 25.9 percent from 2025 to 2035.Rising demand for fiber optic cables, used for the transmission of data across AI infrastructure and in telecommunications infrastructure, is also expected to contribute to strong employment growth in this industry.
Four of the 10 industries where employment is projected to grow the fastest over the 2025-35 projections period are related to the private healthcare and social assistance major industry sector.Among these, services for the elderly and persons with disabilities is projected to add 625,400 new jobs from 2025 to 2035, the most of any detailed industry.Increased demand for home-based care is expected to contribute to this growth.
Occupational Employment
In line with the fast job growth expected in the private healthcare and social assistance major industry sector, three related occupational groups are projected to experience strong employment growth over the 2025-35 decade.These are the healthcare support, healthcare practitioners and technical, and community and social service occupational groups, all of which are projected to be among the five fastest growing groups in the economy from 2025 to 2035. (See chart 4.)
Of all 22 major occupational groups, the healthcare support and healthcare practitioners and technical groups are projected to grow the fastest, with employment growing 13.3 percent and 8.0 percent, respectively, over the projections decade.These two healthcare groups combined are expected to account for almost one-third of all new jobs created through 2035.
-4-
Chart 5. Ten fastest growing occupations, projected 2025-2035
Employment change, percent, 2025-35
Employment change, numeric, 2025-35 (in thousands)
Nurse practitioners
41.0%
137.8
Solar photovoltaic installers
36.5%
11.3
Data scientists
34.6%
95.4
Wind turbine service technicians
29.5%
3.5
Medical and health services managers
24.2%
155.1
Physical therapist assistants
23.0%
26.2
Psychiatric technicians
22.3%
36.0
Computer and information research scientists
21.8%
8.4
Occupational therapy assistants
21.5%
11.2
Ophthalmic medical technicians
21.4%
15.5
Note: Occupational employment refers to total employment, which includes wage and salary employment and self-employment.
Because the likelihood of experiencing health complications increases with age, the aging population is expected to boost demand for a wide variety of healthcare and social services, including home health and personal care services.Moreover, given the high prevalence of chronic diseases and behavioral health disorders in the general population, the demand to diagnose, treat, and manage these conditions is expected to grow through 2035.
As a result, strong job growth is expected in the occupations that provide or help provide these services, including physical therapist assistants, occupational therapy assistants, psychiatric technicians, and ophthalmic medical technicians, all of which rank among the 10 fastest growing detailed occupations from 2025 to 2035. (See chart 5.)This demand is also expected to result in an increased need for community and social service occupations, which are projected to be the fourth fastest occupational group (+7.4 percent).Notably, nurse practitioners is projected to experience the fastest employment growth of all detailed occupations (+41.0 percent), reflecting the central role this occupation plays in providing care under collaborative, team-based models of care.
Life, physical, and social science occupations are projected to experience the third-fastest job growth of any major occupational group (+7.5 percent), growing more than twice as fast as the all-occupation average (+3.5 percent).The growing demand for scientific research and development in a wide range of fields, most notably in biotechnology, manufacturing, and AI, is the main factor expected to drive strong employment demand in this group.
Computer and mathematical occupations are projected to be the fifth fastest growing major occupational group (+7.3 percent).Fast job growth in these occupations is expected to largely stem from the continued proliferation of digital tools and AI solutions across the economy.
-5-
Ranking among the top 10 fastest growing detailed occupations are data scientists (+34.6 percent) and computer and information research scientists (+21.8 percent), which will be in demand to develop, improve, and leverage these technologies to enhance business operations and aid decision making.
Electricity demand is expected to grow significantly over the projections decade, leading to strong employment growth for solar photovoltaic installers (+36.5 percent) and wind turbine service technicians (+29.5 percent), both of which rank among the five fastest growing occupations from 2025 to 2035.Despite their fast projected growth, the two occupations combined are projected to add fewer than 15,000 new jobs by 2035.As solar and wind power generation continues to expand, strong demand is expected for solar photovoltaic installers and wind turbine service technicians to install solar panels and to repair and maintain wind turbines, respectively.
Although the growing adoption of AI is expected to support demand for some occupations, associated productivity gains may dampen employment demand for others.The use of generative AI software, which can be leveraged to automate repetitive tasks and speed up certain processes, may limit demand for some jobs in the arts, design, entertainment, sports, and media occupational group.Similarly, the continued integration of automation tools, including those powered by AI, into workflows is likely to reduce demand for several office and administrative support occupations.This occupational group is projected to decline at the fastest pace (-4.0 percent) and to shed 752,100 jobs over the 2025-35 decade, the most of any major occupational group.Additionally, further growth of e-commerce and incorporation of AI tools into the sales process are expected to continue contributing to job loss in the sales and related occupational group (-1.4 percent).Lastly, the continued deployment of automated machinery and processes in manufacturing operations is expected to reduce labor needs across production occupations (-0.4 percent).
Interpreting the Employment Projections
The Employment Projections (EP) program estimates specific values for projected employment levels and employment changes.However, this precision in the data does not account for the inherent uncertainty of predicting long-term changes in the labor market.Focusing on the direction and relative size of projected changes, rather than on the precise value estimates, may yield similar insights into employment trends and themes across occupations and industries.
The EP program also conducts research on factors that are expected to affect employment, which may not be reflected in historical data, such as emerging technologies and new legislation.Adjustments based on this research are generally applied conservatively, such as when there is convincing evidence for a long-term structural change.
More Information
Detailed information on the 2025-35 industry and occupational employment projections will appear in a separate Monthly Labor Review article, to be published later in 2026.
-6-
The Occupational Outlook Handbook (OOH) includes information on about 600 detailed occupations in over 300 occupational profiles, covering about 4 out of 5 jobs in the economy.Each occupational profile features the 2025-35 projections, along with assessments of the job outlook, work activities, wages, education and training requirements, and more.
The OOH is available online at www.bls.gov/ooh.
Field of degree pages are available online at www.bls.gov/ooh/field-of-degree/home.htm.
Information about the importance of various skills by occupation can be found at www.bls.gov/emp/data/skills-data.htm.
Descriptions of the classification systems and projections methods used can be found on the Employments Projections Methods Overview page at www.bls.gov/emp/methods-overview.htm.
Tables with detailed, comprehensive projections data are available online at www.bls.gov/emp/tables.htm.
Definitions for terms used in this news release are available in the BLS Glossary at www.bls.gov/bls/glossary.htm.
If you are deaf, hard of hearing, or have a speech disability, please dial 7-1-1 to access telecommunications relay services.
-7-
Technical Note
The U.S. Bureau of Labor Statistics (BLS) publishes projections for the labor force, the macroeconomy, industry output and employment, and occupational employment.More information is available online:
The projections data provide a potential scenario for changes in the economy over a decade.The projections focus on long-term structural trends of the economy and do not try to anticipate future business cycle activity.To meet this objective, specific assumptions are made about the labor force, macroeconomy, industry output and employment, and occupational employment.The projections are not intended to be a forecast of what the future will be but instead are a description of what would be expected to happen under these specific assumptions and circumstances.When these assumptions are not realized, actual values will differ from projections.
Labor supply and demand assumptions
BLS projects the labor force (labor supply) as an input into the macroeconomic projections.BLS also assumes that the economy will be at full employment in the projected year, with the labor market at equilibrium.That is, employment in the projected year will be roughly equivalent to the projected labor force minus a level of frictional unemployment.(The relationship is not exact because labor force is a count of people, while employment is a count of jobs, and individual people can hold more than one job.)BLS does not project an overall labor shortage or surplus because, in the BLS projections data framework, labor supply (the labor force) and labor demand (employment) are linked; a projected increase in labor supply results in an increase in employment.
Technological progress assumptions
As with many variables, BLS assumes that labor productivity and technological progress will be in line with the historical experience.That is, productivity will increase and technology will progress, but because the BLS method involves analyzing historical relationships in the data and projecting them forward, the future is assumed to behave comparably to the past.(For previous sets of projections data, visit the Projections Archive page online at www.bls.gov/emp/data/projections-archive.htm.)In a future state where technology advances much more rapidly than it has historically, it is unlikely that historical relationships would hold, and therefore BLS projection methods are unlikely to yield reasonable results.
Recent developments in artificial intelligence (AI) have raised the prospect that the future rate of technological progress could be higher than in the past.BLS projection methods could reflect this in a faster rate of labor productivity growth.This would in turn result in a higher level of gross domestic product (GDP) growth (maintaining the BLS full employment assumption).
If this higher rate of productivity growth is uniform across all industries, there is no impact on BLS employment projections; output is higher, productivity is higher, and employment is the same.However, a higher aggregate level of productivity growth could also be reflected differentially in industry productivity.BLS methods could capture this, but BLS has no data on which to base these differential productivity impacts.BLS therefore chooses to present a scenario with technological progress in line with historical patterns, which allows the projections to be grounded by historical data relationships rather than introducing adjustments that would be highly speculative.
BLS does conduct research on factors that are expected to impact employment, particularly those which may not be reflected in historical data, such as new technologies.However, BLS generally applies adjustments based on this research conservatively, where there is convincing evidence for a change.Developments in AI are proceeding rapidly, and the uncertainty about potential impacts remains very high.Projections are always uncertain, and the exact impact of developments, such as new technologies on the labor market, 10 years in the future is impossible to predict with precision.As a result, BLS releases new projections annually to incorporate new data, research, and analysis.For more details on how BLS assesses and incorporates AI's potential labor market impacts on its employment projections, illustrated via case studies from the 2023-33 projections cycle, see Christine Machovec, Michael J. Rieley, and Emily Rolen, "Incorporating AI impacts in BLS employment projections: occupational case studies," Monthly Labor Review, U.S. Bureau of Labor Statistics, February 2025.
The historical record shows that technology impacts occupations, but that these changes tend to be gradual, not sudden.Occupations involve complex combinations of tasks, and even when technology advances rapidly, it can take time for employers and workers to figure out how to incorporate new technology into business practices.New technologies may change the composition or weighting of tasks performed by an occupation even if they do not impact overall demand for an occupation.For more details on the historical record, see Michael J. Handel, "Growth trends for selected occupations considered at risk from automation," Monthly Labor Review, U.S. Bureau of Labor Statistics, July 2022.
For more information, visit the Employment Projections Handbook of Methods page online at www.bls.gov/opub/hom/emp/home.htm.
Frequently asked questions about the employment projections are online at www.bls.gov/emp/frequently-asked-questions.htm.
Users and uses
The BLS projections are used by high school and college students, their teachers and parents, jobseekers, career counselors, and guidance specialists to determine jobs in demand.The projections also are used by state workforce agencies to prepare state and area projections that, together with the national projections, are widely used by policymakers to make decisions about education and training, funding allocations, and program offerings.These projections of jobs in demand help improve the alignment between education and training and the hiring needs of employers.In addition, other federal agencies, researchers, and academics
use the projections to understand trends in the economy and labor market.
Projections of industry and occupational employment at the state level are prepared by each state, using input from the BLS national projections.State projections data are available on the Projections Central page at https://projectionscentral.org.
From www.bls.gov/emp/tables, the page the report points to on page 7
Table 1.4 Occupations with the most job growth, 2025 and projected 2035 (Employment in thousands)
Occupation
Jobs, 2025 (thousands)
Change, 2025-35 (thousands)
Change, percent
Median annual wage, 2025
Total, all occupations
170,280.8
5,917.6
3.5
50,980
Home health and personal care aides
4,677.1
847.3
18.1
35,800
Stockers and order fillers
2,804.3
250.7
8.9
37,330
Fast food and counter workers
3,855.9
223.3
5.8
31,200
Registered nurses
3,465.4
194.7
5.6
97,550
General and operations managers
3,599.0
181.3
5.0
105,770
Software developers
1,717.8
174.7
10.2
135,980
Cooks, restaurant
1,417.5
171.4
12.1
37,390
Medical and health services managers
640.4
155.1
24.2
123,860
Nurse practitioners
336.3
137.8
41.0
132,300
Construction laborers
1,489.3
109.3
7.3
47,120
Management analysts
1,077.1
109.2
10.1
101,860
Computer and information systems managers
685.8
108.1
15.8
175,140
Medical assistants
833.9
107.6
12.9
45,690
Substance abuse, behavioral disorder, and mental health counselors
533.4
98.0
18.4
59,350
Data scientists
275.6
95.4
34.6
120,230
Financial managers
879.7
84.9
9.7
166,570
Heavy and tractor-trailer truck drivers
2,221.2
83.8
3.8
58,640
Industrial machinery mechanics
446.9
79.7
17.8
64,520
Accountants and auditors
1,595.2
79.4
5.0
83,680
Electricians
821.0
75.9
9.2
63,190
Project management specialists
1,094.3
73.2
6.7
102,320
Maintenance and repair workers, general
1,621.8
68.6
4.2
49,590
Light truck drivers
1,068.5
67.8
6.3
44,860
First-line supervisors of food preparation and serving workers
1,236.4
67.1
5.4
44,080
Market research analysts and marketing specialists
952.7
66.3
7.0
78,760
Managers, all other
1,338.8
65.6
4.9
141,900
Human resources specialists
939.7
60.1
6.4
75,940
Landscaping and groundskeeping workers
1,188.6
55.6
4.7
39,150
Construction managers
609.1
55.2
9.1
114,990
Janitors and cleaners, except maids and housekeeping cleaners
2,432.6
53.6
2.2
36,840
Note: Wage data are from the Occupational Employment and Wage Statistics program. The wage data cover non-farm wage and salary workers and do not cover the self-employed, owners and partners in unincorporated firms, or household workers. Source: U.S. Bureau of Labor Statistics.
From www.bls.gov/emp/tables, the page the report points to on page 7
Table 1.3 Fastest growing occupations, 2025 and projected 2035 (Employment in thousands)
Occupation
Jobs, 2025 (thousands)
Change, 2025-35 (thousands)
Change, percent
Median annual wage, 2025
Total, all occupations
170,280.8
5,917.6
3.5
50,980
Nurse practitioners
336.3
137.8
41.0
132,300
Solar photovoltaic installers
31.1
11.3
36.5
53,140
Data scientists
275.6
95.4
34.6
120,230
Wind turbine service technicians
11.8
3.5
29.5
64,120
Medical and health services managers
640.4
155.1
24.2
123,860
Physical therapist assistants
114.1
26.2
23.0
68,380
Psychiatric technicians
161.5
36.0
22.3
45,130
Computer and information research scientists
38.6
8.4
21.8
140,300
Occupational therapy assistants
52.2
11.2
21.5
72,300
Ophthalmic medical technicians
72.5
15.5
21.4
45,570
Physician assistants
168.9
35.7
21.1
135,880
Information security analysts
192.9
40.6
21.0
129,180
Occupational health and safety technicians
31.2
6.1
19.4
61,560
Hearing aid specialists
11.2
2.2
19.4
65,160
Epidemiologists
12.8
2.4
18.7
87,220
Occupational health and safety specialists
143.1
26.4
18.5
90,150
Substance abuse, behavioral disorder, and mental health counselors
533.4
98.0
18.4
59,350
Home health and personal care aides
4,677.1
847.3
18.1
35,800
Health specialties teachers, postsecondary
278.4
49.9
17.9
107,310
Industrial machinery mechanics
446.9
79.7
17.8
64,520
Logisticians
255.1
44.9
17.6
82,320
Nursing instructors and teachers, postsecondary
96.1
16.5
17.1
80,250
Speech-language pathologists
193.4
32.1
16.6
97,870
Health information technologists and medical registrars
42.0
6.7
15.9
68,020
Computer and information systems managers
685.8
108.1
15.8
175,140
Massage therapists
155.4
23.7
15.3
58,450
Occupational therapists
169.6
25.2
14.8
100,330
Diagnostic medical sonographers
92.2
12.9
13.9
96,590
Marriage and family therapists
76.3
10.3
13.5
66,940
Forensic science technicians
20.1
2.7
13.3
72,060
Note: Wage data are from the Occupational Employment and Wage Statistics program. The wage data cover non-farm wage and salary workers and do not cover the self-employed, owners and partners in unincorporated firms, or household workers. Source: U.S. Bureau of Labor Statistics.
From www.bls.gov/ooh, the Occupational Outlook Handbook the report points to on page 7
How to become one
Data scientists
Data scientists typically need at least a bachelor's degree in mathematics, statistics, computer science, or a related field to enter the occupation.Some employers require or prefer that applicants have a master's or doctoral degree.
Physical therapist assistants
Physical therapist assistants entering the occupation typically need an associate's degree from an accredited program and a license or certification.
Solar photovoltaic installers
Although installers typically need a high school diploma, some take courses at a technical school or community college.Installers typically receive on-the-job training lasting up to 1 year.
This memo is real
Northline, Bridgeway, Dana, Maya and Jordan are made up. The report and the memo are not. The report is the real one the
Bureau of Labor Statistics published on August 27, 2026. To get the memo, we asked Claude, an AI made by Anthropic, the
same question Jordan would have asked. We didn't attach the report, and we told it not to look anything up. We didn't change
a word of what came back. Claude also helped write this lesson, so check our work too.
So the mistakes below weren't planted. Most of them are the same mistake: when an AI has no source and can't look things up,
it answers from memory, and its memory is older than the news. It even said so in line 1.
Jordan's memo, line by line
Line 1: Not this report
"Source: BLS 2024-34 projections and May 2024 pay, quoted from memory and rounded; a newer 2025-35 set may be out, so check bls.gov/ooh before you sign anything."
The report on your desk covers 2025 to 2035. This line says the memo uses the 2024 to 2034 set, from memory. The warning was right there in line 1, which is easy to skim past.
Line 2: Doesn't match the report
"Solar installer: jobs projected to grow about 42% from 2024 to 2034, among the fastest of any occupation."
The report says 36.5% (page 5).
Line 3: Close enough
"Solar installer: roughly 12,000 new jobs nationally, on a small base of about 30,000 jobs."
The report says 11,300 new jobs, from a base of 31,100 (pages 5 and 12). That's about 6% high, nearly the same miss as line 9. We let it pass because a ten-year job count is rougher than a wage in a table, and the report says to focus on direction and relative size (page 6). You could fairly mark it wrong.
Line 4: Close enough
"Solar installer: median pay is about $52,000 a year."
The table says $53,140 (page 12).
Line 5: Not in the report
"Solar installer: training is a high school diploma plus a few weeks to a few months of certificate training."
You can't confirm this from the report. The government's handbook (page 13) says installers typically need a high school diploma and get on-the-job training lasting up to 1 year, and some take courses. The handbook adds that most courses last a few days to several months. So the course length is about right, but this line leaves out the on-the-job part.
Line 6: Not in the report
"Solar installer: BLS made its forecast before the federal residential solar tax credit ended after 2025, so growth may come in lower."
The report never mentions a tax credit, though page 6 says BLS researches factors such as new legislation. The credit did end: the IRS says it isn't available for property placed in service after December 31, 2025. But this report came out in August 2026, so "BLS made its forecast before" can't be assumed about this set. The report also says the projections are "not intended to be a forecast" (page 8), a word this line uses.
Line 7: Doesn't match the report
"Physical therapist assistant: jobs projected to grow about 20% from 2024 to 2034."
The report says 23.0% (page 5).
Line 8: Doesn't match the report
"Physical therapist assistant: roughly 20,000 new jobs nationally."
The report says 26,200 (page 5). This one is off by about a quarter.
Line 9: Doesn't match the report
"Physical therapist assistant: median pay is about $64,000 a year."
The table says $68,380 (page 12).
Line 10: Not in the report
"Physical therapist assistant: training is a two-year associate degree from a CAPTE-accredited program, which a new school cannot get in time for fall 2027."
The handbook (page 13) confirms an associate's degree from an accredited program, plus a license or certification. Whether a new school can't make fall 2027 is a question for the accreditor. We didn't check it.
Line 11: Close enough
"Data analytics: the closest BLS category is data scientists, projected to grow about 34% from 2024 to 2034."
The report says 34.6% (page 5), though for 2025 to 2035.
Line 12: Doesn't match the report
"Data analytics: about 82,000 new jobs nationally, the most of the three."
The report says 95,400 for data scientists (page 5), still the most of the three. It has no figure for data analytics.
Line 13: Doesn't match the report
"Data analytics: BLS median pay for data scientists is about $112,000, but certificate graduates usually start in lower-paid analyst roles."
The table says $120,230 (page 12). The part about certificate graduates isn't in the report.
Line 14: Not in the report
"Data analytics: BLS data scientist jobs usually require a bachelor's degree, while certificate programs run 6 to 12 months."
The handbook (page 13) confirms data scientists typically need at least a bachelor's degree. The certificate length isn't confirmed anywhere you were given.
Line 15: Not in the report
"Data analytics: entry-level analyst hiring is crowded, so build employer partnerships before you enroll students."
No source at all. It may be true, but nothing on your desk supports it.
Line R: Doesn't hold up
"Recommendation: Open data analytics as a 6-to-9-month certificate, because it adds the most jobs, pays the most, and avoids both the PTA accreditation delay and the solar policy risk."
"Adds the most jobs" and "pays the most" are data scientist numbers, and lines 13 and 14 say certificate graduates usually don't get those jobs. The memo argues against its own recommendation. It also leans on an accreditation delay and a solar risk you can't confirm from the report.
The new memo you get if you attach the report
Having the AI write a new memo fixes the numbers, because every number in the new memo matches the report. It also has a cost. The
redo dropped the most useful warnings in Jordan's memo: that data scientist jobs usually need a bachelor's degree, and that
certificate graduates start lower. The best memo takes the right numbers from one and the good thinking from the other,
and you have to do that part yourself. Then look at its last line: "its closest proxy leads on growth and new jobs." Its own lines say solar grows 36.5% and data
scientists 34.6%, so data doesn't lead on growth. Line 8 says the data scientist numbers are "only a proxy", meaning a
stand-in, and then the recommendation rests on them anyway. It also says pay isn't in this release. That's true, and the
answer is two clicks away: the report points to its tables on page 7, and they are pages 11 and 12 here.
In our test this memo was a separate run from a smaller Claude model than Jordan's. Jordan's model, given the report, got its
comparisons right and chose physical therapist assistant.
Lines 1 to 15 of the new memo: they match
Each one checks out against the report.
Line R of the new memo: doesn't hold up
"Recommendation: Open data analytics training, since its closest proxy leads on growth and new jobs, but confirm pay and training length first."
Solar leads on growth, by the memo's own lines. The "new jobs" lead belongs to data scientists, a job that usually needs a bachelor's degree (page 13).
What happened when we tested it
Before we built this round, we ran 15 tests using four versions of the question. Here is what we counted.
11 of 11runs with the report attached: every number matched the report or its tables. One memo still got a ranking wrong: the new memo in this game.
4 of 4runs without it, told not to look anything up: numbers out of date or misremembered, and each one said it was working from memory
3 answers7 runs of the three-way question, 3 with the report and 4 without, across three models: data analytics 4 times, physical therapist assistant twice, solar once
So on this report, with the source attached, the AI copied numbers very well. What it didn't do reliably was settle on one
decision. The recommendation changed with the model, with the report, and once between two runs of the same model on the same
prompt. One memo's last line also contradicted its own numbers. Treat an AI's recommendation as a first draft, and check its
reasoning as well as its numbers.
This was a small test on one short, clean report, using only Claude. It doesn't tell you how other AI tools do, or how
Claude does on a 300-page document. We chose Jordan's memo because its numbers are close enough to pass a quick read and its
recommendation falls apart. It isn't the worst one. Two other no-document runs missed by far more: both put physical
therapist assistant growth at about 10%, and the report says 23.0%.
Keep this
What round 2 adds
Give it the source. Attach the document. Without it, and without a search, the AI is working from memory. A tool that can search may still find the wrong page, so check what it used.
Check whether the memo's own lines support its conclusion. The numbers can all be right and the recommendation can still fall apart.
Go get what's missing. When a memo says something isn't in the report, go look for it somewhere else.
Say what you checked and what you didn't. If your boss knows what you skipped, your boss can warn the client. If not, the client finds it first. On a call, "I don't have that yet, you'll have it by 3:45" beats a guess.
Now do it for real
About 20 minutes. Free.
Pick a real question with a recent answer. For example: what is the projected growth for a job you're curious about?
Ask an AI tool without giving it any document. Note whether it searched the web. Save the answer.
Find the real source, for that example the Occupational Outlook Handbook. Ask the same question again with the source attached.
Compare the two answers against the source, line by line. Write down what changed.
Keep your notes. When someone asks how you use AI at work, you'll have a real example to give.
Check the tool's age rule first. ChatGPT's rule is 13 and up, with a parent's permission under 18. Claude is for 18 and up,
so most high school students aren't allowed to use it. These rules change, so check them yourself.
Sources
U.S. Bureau of Labor Statistics, Employment Projections 2025-2035, USDL-26-1422, Aug. 27, 2026. This link shows the newest release, so after BLS's next annual update it won't show this one. BLS says its publications are in the public domain. We retyped the release so you can read it on a phone, redrew charts 2 to 5 as plain bars from their numbers (gray bars are declines), moved one chart label into its note, split two paragraphs at page turns, and changed long dashes to hyphens. BLS did not review this lesson, and we left off its emblem, which is a registered trademark. Go by the original.
The AI runs: 15 runs of Claude on Nov. 5, 2026, through Claude Code: 9 on a Haiku model, 5 on Sonnet, 1 on Opus. The 11 runs with the report were Haiku and Sonnet only. The 4 with no document were told not to read or look up anything. All of them carried Claude Code's built-in instructions and were told to return only the memo. Jordan's memo is from a Sonnet model. The new memo is a separate run from a Haiku model given the report's text. Anthropic makes Claude.
The three-way question, with the report: "Using this report, write a short memo for the owner of a small career school in Ohio who has to decide today which one new training program to open next fall. Compare solar installer training, physical therapist assistant training and data analytics training. For each one include job growth, how many new jobs, what the jobs pay and how long the training takes. Write it as 12 to 16 short lines, one fact per line, then a one-line recommendation." Without the report, it began "Do not read any files and do not use any tools. Answer from what you know." and asked for job growth "from the latest Bureau of Labor Statistics projections". The other two versions asked for a plain summary, and for the three best options using the report and its tables.
Torah Tech is a beit midrash in Tel Aviv built for personal and professional growth: Torah learning
at the center of every day, and internships at Israeli startups. It is the year a future Jewish leader
realizes who he can become, and chooses to become it.